

When Hawks Cry
A hawkish tone from the Fed leaves investors in a sad state • April 2022
Key Observations
- The quick and material rise in interest rates had significant impacts across asset classes in both April and the year so far.
- Investment grade fixed income is off to the worst four-month start since 1976 due to rising rates, inflation concerns, interst rate sensitivity in benchmarks and widening credit spreads.
- While equity markets retreated broadly, geographies and styles most exposed to higher rates lagged more.
- Our outlook for 2022 remains simlar to how we entered the year, emphasizing caution toward greater volatility ahead.

Market Recap
“I would say 50 basis points will be on the table for the May meeting,” said Chairman Powell on April 21 during a press conference. Pursuing a dual mandate of both full employment and price stability, the Federal Reserve (the Fed) is under pressure to cool off inflation which is near 40-year highs. Higher rates have had an adverse impact on many asset prices globally.

Market Recap
In March, the Consumer Price Index (CPI) rose by 8.5 percent4 year-over-year. Even though 82 percent5 of the March increase came from energy and food, considered the more volatile parts of inflation, the Fed acknowledged a need to regain control of prices.
Thus far, the Fed’s only direct action has been to increase the Fed Funds rate by 0.25 percent in March. At the time of writing, the futures market was pricing in a 99.1 percent probability of a 0.50 percent move at the May meeting and a total of ten 0.25 percent increases in 2022 ending the year with a Fed Funds rate of 3.0 -3.25 percent.6
If predictions become reality, that would mark the most hawkish move by the Fed since 1994 when then Fed chair Alan Greenspan increased rates by 3 percent over a year.
In 1994 the Bloomberg Aggregate was down nearly 2 percent while the Fed raised rates, but it was buoyed by a starting yield-to-worst of 5.62 percent (Fiducient Advisors: Fixed Income Complanency), a benefit we do not enjoy today with significantly lower rates.8 The yield-to-worst on the Bloomberg Aggerate was 1.75 percent at the start of 2022.9
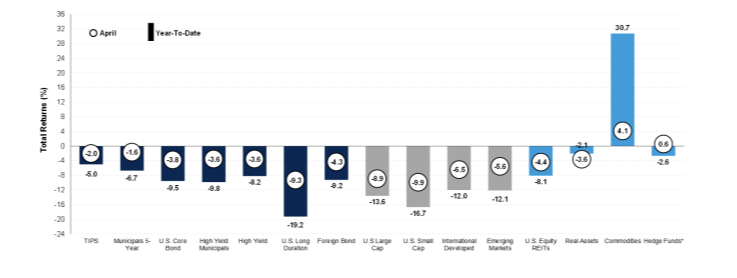
Although most of the Fed’s action is still ahead of us, the fixed income market has taken them at their word. The Bloomberg Aggregate is off to its worst start since its inception. With few places to hide as demonstrated by the matrix of various fixed income segments shown below, 2022 has been a hard year for bond investors thus far.

While higher rates and lower fixed income prices is a common connection, the connectivity does not stop there. The reverberating effect of higher interest rates has shown its impact throughout the market.
Higher rates showed their sedative powers on highly priced stocks again in April, continuing the trend for 2022. The linkage goes like this:
- Often when valuing a stock an investor will look at the
future earnings power of a business. - To value those future earnings in today’s dollars they
will use a discount rate. - The higher the discount rate, the lower the value of
the stock.
So, higher rates lead to more conservative estimates of value. This has had a disproportionate impact on stocks that are heavily reliant on future earnings growth to justify their high valuations. As we can see below, stocks with higher valuations fell more than their less expensive peers which also impacted growth-oriented indexes more acutely. Higher rates do not just stop there. They also impact currency prices and thus far, the Fed has been more hawkish than other central banks, moving U.S. rates higher than those abroad. This in turn makes the U.S. dollar more attractive than other currencies and by extension, assets priced in other currencies are worth less in U.S. dollars if the dollar appreciates.